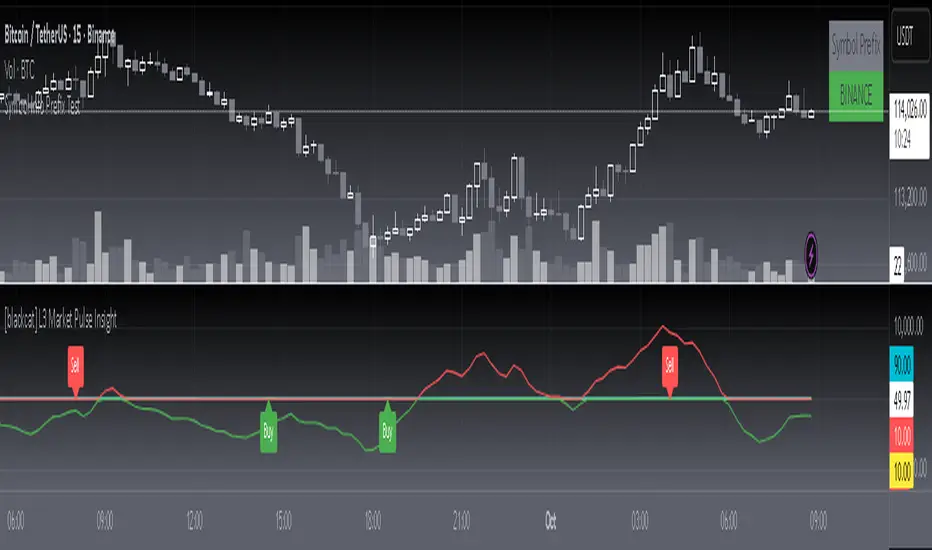
[blackcat] L3 Market Pulse InsightOVERVIEW
The L3 Market Pulse Insight provides comprehensive analytics by evaluating key price metrics to reveal critical market sentiment and potential trade opportunities 📊🔍. This advanced indicator leverages proprietary calculations involving Simple Moving Averages (SMAs), Exponential Moving Averages (EMAs), and custom thresholds to deliver detailed insights into current market dynamics 🚀✨.
By plotting various lines representing core fundamentals and directional cues, traders gain visibility into underlying trends and shifts within the market pulse. The visual aids simplify complex data interpretation, making it easier for users to make strategic decisions based on clear, actionable information ✅⛈️.
FEATURES
Advanced Calculation Techniques:
Employs sophisticated formulas integrating SMAs and EMAs for precise trend analysis.
Incorporates fundamental lines and confirmations based on recent price extremes.
Comprehensive Visualization:
Plots multiple informational lines: Fundamental Line, Thresholds, Institutional Directions, etc., each reflecting unique aspects of price behavior.
Uses distinct colors for easy differentiation between bearish and bullish indications.
Customizable Alerts:
Generates "Buy" and "Sell" labels at pivotal moments, highlighting entry/exit points visually.
Offers flexibility to modify alert styles and positions according to user preferences.
Dynamic Adaptability:
Continuously updates plots and alerts based on incoming real-time data for timely responses.
Provides dynamic support/resistance levels adapting to evolving market conditions.
HOW TO USE
Installing the Indicator:
To start using the L3 Market Pulse Insight, add it via the Pine Editor on TradingView:
Open the editor from the bottom panel.
Copy-paste the provided script code.
Click “Add to Chart” after pasting.
Understanding Key Lines:
Familiarize yourself with what each plotted line signifies:
Fundamental Line: Represents core price movements adjusted through SMA transformations.
Low Confirmation & Warnings: Provide early signals about potential reversals or continuation scenarios.
Threshold B: Acts as a significant barrier indicating overbought/sold conditions.
Institutional Directions: Offer insights into larger player activities and intentions.
Interpreting Signals:
Pay close attention to generated "Buy" and "Sell" labels appearing directly on your chart:
"Buy" Label: Indicates favorable momentum crossing from below the confirmation level upwards.
"Sell" Label: Suggests bearish transitions when moving beneath set thresholds.
Adjusting Parameters:
While this version primarily uses default settings derived from optimal testing ranges, feel free to experiment:
Modify lookback periods in SMA/EMA functions if different timeframes align better with your strategy.
Customize plot colors/styles for enhanced readability and personal taste.
Integrating with Other Tools:
Enhance the reliability of signals produced by combining them with complementary indicators like RSI, MACD, or volume profiles for thorough validation.
Continuous Monitoring:
Regularly review performance and refine strategies incorporating insights gathered from L3 Market Pulse Insight across varying markets and assets.
LIMITATIONS
Data Dependency: Performance heavily relies on accurate historical data without anomalies.
Market Conditions Variability: Effectiveness may vary during extreme volatility or thin liquidity environments.
Parameter Fine-Tuning: Optimal configuration might differ significantly across instruments; continuous adjustments are necessary.
No Guarantees: Like any tool, this doesn't ensure profits and should be part of a broader analytical framework.
NOTES
Ensure solid grounding in technical analysis principles before deploying solely upon these insights.
Utilize backtesting rigorously under diverse market cycles to assess robustness thoroughly.
Consider external factors such as economic reports, geopolitical events influencing asset prices beyond purely statistical models.
Maintain discipline adhering predefined risk management protocols regardless of signal strength displayed here.
THANKS
We appreciate every member's contributions who have engaged actively throughout our development journey, offering constructive feedback driving improvements continually 🙏. Together we strive toward creating ever-more robust tools empowering traders worldwide!
Tìm kiếm tập lệnh với "volume profile"
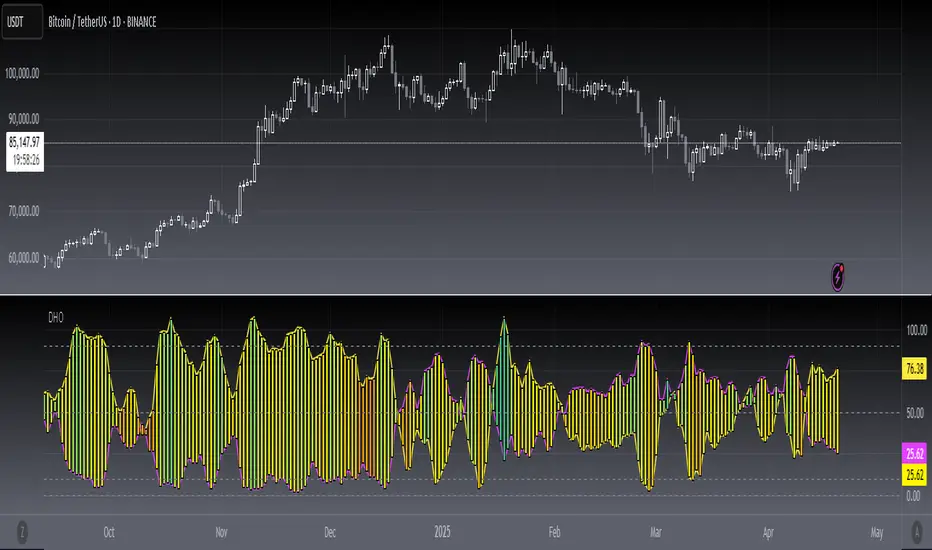
[blackcat] L3 Dark Horse OscillatorOVERVIEW
The L3 Dark Horse Oscillator is a sophisticated technical indicator meticulously crafted to offer traders deep insights into market momentum. By leveraging advanced calculations involving Relative Strength Value (RSV) and proprietary oscillatory techniques, this script provides clear and actionable signals for identifying potential buying and selling opportunities. Its distinctive feature—a vibrant gradient color scheme—enhances readability and makes it easier to visualize trends and reversals on the chart 📈↗️.
FEATURES
Advanced Calculation Methods: Utilizes complex algorithms to compute the Relative Strength Value (RSV) over specific periods, providing a nuanced view of price movements.
Default Period: 27 bars for initial RSV calculation.
Additional Period: 36 bars for extended RSV analysis.
Dual-Oscillator Components:
Component A: Derived using multiple layers of Simple Moving Averages (SMAs) applied to the RSV, offering a smoothed representation of short-term momentum.
Component B: Employs a unique averaging method tailored to capture medium-term trends effectively.
Dynamic Gradient Color Scheme: Enhances visualization through a spectrum of colors that change dynamically based on the calculated values, making trend identification intuitive and engaging 🌈.
Customizable Horizontal Reference Lines: Key levels are marked at 0, 10, 50, and 90 to serve as benchmarks for assessing the oscillator's readings, helping traders make informed decisions quickly.
Comprehensive Visual Representation: Combines the strengths of both components into a single, gradient-colored candlestick plot, providing a holistic view of market sentiment and momentum shifts 📊.
HOW TO USE
Adding the Indicator: Start by adding the L3 Dark Horse Oscillator to your TradingView chart via the indicators menu. This will overlay the necessary plots directly onto your price chart.
Interpreting the Components: Familiarize yourself with the two primary components represented by yellow and fuchsia lines. These lines indicate the underlying momentum derived from the RSV calculations.
Monitoring Momentum Shifts: Pay close attention to the gradient-colored candlesticks, which reflect the combined strength of both components. Notice how these candles transition through various shades, signaling changes in market dynamics.
Utilizing Reference Levels: Leverage the horizontal lines at 0, 10, 50, and 90 as critical thresholds. For instance, values above 50 might suggest bullish conditions, while those below could hint at bearish tendencies.
Combining with Other Tools: To enhance reliability, integrate this indicator with complementary technical analyses such as moving averages, volume profiles, or other oscillators like RSI or MACD.
LIMITATIONS
Market Volatility: In extremely volatile or sideways-trending markets, the indicator might produce false signals due to erratic price movements. Always cross-reference with broader market contexts.
Testing Required: Before deploying the indicator in real-time trading, conduct thorough backtesting across diverse assets and timeframes to understand its performance characteristics fully.
Asset-Specific Performance: The efficacy of the L3 Dark Horse Oscillator can differ significantly across various financial instruments and market conditions. Tailor your strategies accordingly.
NOTES
Historical Data: Ensure ample historical data availability to facilitate precise calculations and avoid inaccuracies stemming from insufficient data points.
Parameter Adjustments: Experiment with adjusting the default periods (27 and 36 bars) if you find them unsuitable for your specific trading style or market conditions.
Visual Customization: Modify the appearance settings, including line styles and gradient colors, to better suit personal preferences without compromising functionality.
Risk Management: While the indicator offers valuable insights, always adhere to robust risk management practices to safeguard against unexpected market fluctuations.
EXAMPLE STRATEGIES
Trend Following: Use the oscillator to confirm existing trends. When Component A crosses above Component B, consider entering long positions; conversely, look for short entries during downward crossovers.
Mean Reversion: Identify extreme readings near the upper (90) or lower (10) bands where prices might revert to mean levels, presenting potential reversal opportunities.
Divergence Analysis: Compare the oscillator's behavior with price action to spot divergences, which often precede trend reversals. Bullish divergence occurs when prices make lower lows but the oscillator shows higher lows, suggesting upward momentum.
VPSRVP Sovereign Reign (VPSR) - Advanced Volume Profile Analysis
A sophisticated volume analysis tool that provides deep insights into market participation and momentum through an intuitive visual interface. This indicator helps traders identify significant market moves, potential reversals, and institutional activity.
Key Features:
1. Smart Volume Analysis
• Dynamic volume profiling
• Institutional participation detection
• Abnormal volume identification
• Real-time momentum tracking
2. Advanced Visual System
• Color-coded volume bars
• Adaptive cloud formation
• Reversal pattern detection
• Fake-out warning system
Visual Components:
1. Volume Bars
• Green: Bullish pressure with normal volume
• Purple: Bearish pressure with normal volume
• White: Significant bullish participation
• Pink: Significant bearish participation
• Orange: High-probability reversal zones
2. Dynamic Cloud
• White Cloud: Bullish control zone
• Purple Cloud: Bearish control zone
• Cloud density indicates participation strength
• Adaptive to market conditions
Signal Interpretation:
1. Normal Market Conditions
• Green/Purple bars show directional pressure
• Cloud color indicates dominant force
• Cloud height shows average participation
2. Significant Events
• White/Pink bars signal major moves
• Orange bars highlight potential reversals
• Cloud expansion shows increasing activity
• Cloud contraction indicates consolidation
Customization Options:
• Volume MA Length: Smoothing factor
• Abnormal Volume Threshold: Sensitivity
• Cloud Display: Toggle visualization
• Color scheme optimization
Best Practices:
1. Multiple Timeframe Analysis
• Start with higher timeframes
• Confirm on lower timeframes
• Watch for confluence
2. Volume Analysis
• Compare to historical levels
• Monitor abnormal spikes
• Track participation trends
3. Trade Management
• Use as confirmation tool
• Wait for clear signals
• Monitor fake-out warnings
• Combine with price action
Trading Applications:
1. Trend Analysis
• Identify strong moves
• Spot weakening trends
• Detect consolidation
2. Reversal Detection
• Spot potential turning points
• Identify fake-outs
• Monitor institutional activity
3. Risk Management
• Volume-based position sizing
• Stop loss placement
• Profit target selection
The VP Sovereign Reign indicator excels at:
• Identifying significant market moves
• Detecting institutional participation
• Warning of potential reversals
• Highlighting fake-outs
• Providing clear market context
Risk Warning:
This indicator is designed as a technical analysis tool and should be used as part of a complete trading strategy. Past performance does not guarantee future results. Always employ proper risk management techniques.
Note: For optimal results, use in conjunction with price action analysis and other complementary indicators.

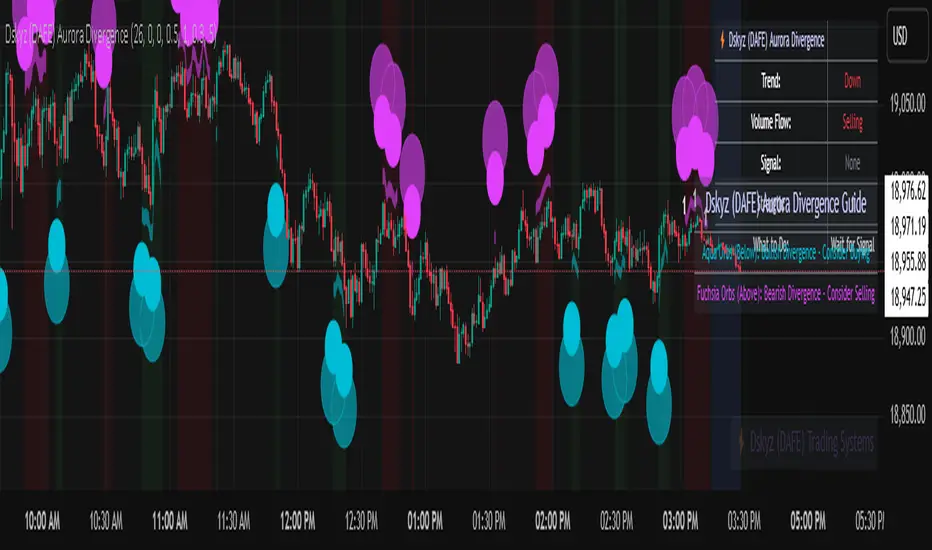
Dskyz (DAFE) Aurora Divergence - Dskyz (DAFE) Aurora Divergence Indicator
Advanced Divergence Detection for Traders. Unleash the power of divergence trading with this cutting-edge indicator that combines price and volume analysis to spot high-probability reversal signals.
🧠 What Is It?
The Dskyz (DAFE) Aurora Divergence Indicator is designed to identify bullish and bearish divergences between the price trend and the On Balance Volume (OBV) trend. Divergence occurs when the price of an asset and a technical indicator (in this case, OBV) move in opposite directions, signaling a potential reversal. This indicator uses linear regression slopes to calculate the trends of both price and OBV over a specified lookback period, detecting when these two metrics are diverging. When a divergence is detected, it highlights potential reversal points with visually striking aurora bands, orbs, and labels, making it easy for traders to spot key signals.
⚙️ Inputs & How to Use Them
The indicator is highly customizable, with inputs grouped under "⚡ DAFE Aurora Settings" for clarity. Here’s how each input works:
Lookback Period: Determines how many bars are used to calculate the price and OBV slopes. Higher values detect longer-term trends (e.g., 20 for 1H charts), while lower values are more responsive to short-term movements.
Price Slope Threshold: Sets the minimum slope value for the price to be considered in an uptrend or downtrend. A value of 0 allows all slopes to be considered, while higher values filter for stronger trends.
OBV Slope Threshold: Similar to the price slope threshold but for OBV. Helps filter out weak volume trends.
Aurora Band Width: Adjusts the width of the visual bands that highlight divergence areas. Wider bands make the indicator more visible but may clutter the chart.
Divergence Sensitivity: Scales the strength of the divergence signals. Higher values make the indicator more sensitive to smaller divergences.
Minimum Strength: Filters out weak signals by only showing divergences above this strength level. A default of 0.3 is recommended for beginners.
Signal Cooldown (Bars): Prevents multiple signals from appearing too close together. Default is 5 bars, reducing chart clutter and helping traders focus on significant signals.
These inputs allow traders to fine-tune the indicator to match their trading style and timeframe.
🚀 What Makes It Unique?
This indicator stands out with its innovative features:
Price-Volume Divergence: Combines price trend (slope) and OBV trend for more reliable signals than price-only divergences.
Aurora Bands: Dynamic visual bands that highlight divergence zones, making it easier to spot potential reversals at a glance.
Interactive Dashboard: Displays real-time information on trend direction, volume flow, signal type, strength, and recommended actions (e.g., "Consider Buying" or "Consider Selling").
Signal Cooldown: Ensures only the most significant divergences are shown, reducing noise and improving usability.
Alerts: Built-in alerts for both bullish and bearish divergences, allowing traders to stay informed even when not actively monitoring the chart.
Beginner Guide: Explains the indicator’s visuals (e.g., aqua orbs for bullish signals, fuchsia orbs for bearish signals), making it accessible for new users.
🎯 Why It Works
The indicator’s effectiveness lies in its use of price-volume divergence, a well-established concept in technical analysis. When the price trend and OBV trend diverge, it often signals a potential reversal because the underlying volume support (or lack thereof) is not aligning with the price action. For example:
Bullish Divergence: Occurs when the price is making lower lows, but the OBV is making higher lows, indicating weakening selling pressure and potential upward reversal.
Bearish Divergence: Occurs when the price is making higher highs, but the OBV is making lower highs, suggesting weakening buying pressure and potential downward reversal.
The use of linear regression ensures smooth and accurate trend calculations over the specified lookback period. The divergence strength is then normalized and filtered based on user-defined thresholds, ensuring only high-quality signals are displayed. Additionally, the cooldown period prevents signal overload, allowing traders to focus on the most significant opportunities.
🧬 Indicator Recommendation
Best For: Traders looking to identify potential trend reversals in any market, especially those where volume data is reliable (e.g., stocks, futures, forex).
Timeframes: Suitable for all timeframes. Adjust the lookback period accordingly—smaller values for shorter timeframes (e.g., 1H), larger for longer ones (e.g., 4H or daily).
Pair With: Support and resistance levels, trend lines, other oscillators (e.g., RSI, MACD) for confirmation, and volume profile tools for deeper analysis.
Tips:
Look for divergences at key support/resistance levels for higher-probability setups.
Pay attention to signal strength; higher strength divergences are often more reliable.
Use the dashboard to quickly assess market conditions before entering a trade.
Set up alerts to catch divergences even when not actively watching the chart.
🧾 Credit & Acknowledgement
This indicator builds upon the classic concept of price-volume divergence, enhancing it with modern visualization techniques, advanced filtering, and user-friendly features. It is designed to provide traders with a powerful yet intuitive tool for spotting reversals.
📌 Final Thoughts
The Dskyz (DAFE) Aurora Divergence Indicator is more than just a divergence tool; it’s a comprehensive trading assistant that combines advanced calculations, intuitive visualizations, and actionable insights. Whether you’re a seasoned trader or just starting out, this indicator can help you spot high-probability reversal points with confidence.
Use it with discipline. Use it with clarity. Trade smarter.
**I will continue to release incredible strategies and indicators until I turn this into a brand or until someone offers me a contract.
-Dskyz
Volume Flow RatioVolume Flow Ratio (VFR) Indicator
Overview
The Volume Flow Ratio (VFR) is a sophisticated volume analysis tool that measures current trading volume relative to the maximum volume of the previous period. Unlike traditional volume indicators that show raw volume or simple moving averages, VFR provides context by comparing current activity to recent maximum activity levels.
Core Features
1. Split Period Analysis
- Multiple Timeframe Options:
- Daily: Compares to previous day's maximum
- Weekly: Week-to-week comparison
- NYSE Weekly: Specialized for stock market trading (Monday-Friday only)
- Monthly: Month-to-month analysis
- Quarterly: Quarter-to-quarter perspective
- Yearly: Year-over-year volume comparison
2. Ratio-Based Measurement
- Displays volume as a ratio (0 to 1+) rather than raw numbers
- 1.0 represents volume equal to previous period's maximum
- Example: If previous max was 50,000 contracts:
- Current volume of 25,000 shows as 0.5
- Current volume of 75,000 shows as 1.5
3. Triple Coloring Modes
- Moving Average Based:
- Compares current ratio to its moving average
- Customizable MA period
- Green: Above MA (higher than average activity)
- Red: Below MA (lower than average activity)
- Previous Candle Comparison:
- Simple increase/decrease from previous bar
- Green: Higher than previous bar
- Red: Lower than previous bar
- Candle Color Based:
- Syncs with price action
- Green: Bullish candles (close > open)
- Red: Bearish candles (close < open)
Primary Use Cases
1. Volume Profile Analysis
- Perfect for traders who need to understand when markets are most active
- Helps identify unusual volume spikes relative to recent history
- Useful for timing entries and exits based on market participation
2. Market Activity Traders
Ideal for traders who:
- Need to identify high-liquidity periods
- Want to avoid low-volume periods
- Look for volume breakouts or divergences
- Trade based on institutional participation levels
3. Mean Reversion Traders
Helps identify:
- Overextended volume conditions (potential reversals)
- Volume exhaustion points
- Return to normal volume levels after spikes
4. Momentum Traders
Useful for:
- Confirming trend strength through volume
- Identifying potential trend exhaustion
- Validating breakouts with volume confirmation
Advantages Over Traditional Volume Indicators
1. Contextual Analysis
- Shows relative strength rather than raw numbers
- Easier to compare across different time periods
- Automatically adjusts to changing market conditions
2. Period-Specific Insights
- Respects natural market cycles (daily, weekly, monthly)
- Special handling for NYSE trading days
- Eliminates weekend noise in stock market analysis
3. Flexible Visualization
- Three distinct coloring methods for different trading styles
- Clear reference line at 1.0 for quick analysis
- Histogram style for easy pattern recognition
Best Practices
For Day Traders
- Use Daily split for intraday volume patterns
- MA coloring mode with shorter periods (5-10)
- Focus on ratios during market hours
For Swing Traders
- Weekly or NYSE Weekly splits
- Longer MA periods (15-20)
- Look for sustained volume patterns
For Position Traders
- Monthly or Quarterly splits
- Candle color mode for trend confirmation
- Focus on major volume shifts
Limitations
- Requires one full period to establish baseline
- May be less effective in extremely low volume conditions
- NYSE Weekly mode specific to stock market hours
This indicator is particularly valuable for traders who understand that volume is a crucial component of price action but need a more sophisticated way to analyze it than simple volume bars. It's especially useful for those who trade based on market participation levels and need to quickly identify whether current volume is significant relative to recent history.

Session extensions [dani]Session Extension
Indicator Description
The Session Extensions indicator is a customizable tool designed to visually represent key price levels during a specified trading session. It calculates and displays the high, low, and midpoints of the session, along with extension levels based on user-defined multipliers. These extensions help traders identify potential support and resistance zones beyond the initial session range.
This indicator is particularly useful for intraday traders who rely on session-based analysis to make informed decisions. It overlays directly on the chart, ensuring seamless integration with price action.
Key Features
Session-Based Analysis : Tracks and highlights key price levels (high, low, midpoint) during a specific trading session.
Customizable Extension Levels : Allows users to define up to six extension levels (both above and below the session range) with unique multipliers, colors, styles, and widths.
Real-Time Updates : Automatically updates during the active session and resets at the start of a new session.
Usage Guidelines
Add the Indicator to Your Chart : Apply the Session Extensions indicator to your chart to visualize key session-based levels.
Intraday Focus : This indicator is optimized for intraday trading. Ensure that the chart's timeframe is set to an intraday interval (e.g., 1-minute, 5-minute).
Session Alignment : Verify that the session time aligns with your trading schedule and timezone. Misalignment may result in incorrect session detection. (This indicator use America - New York timezone)
Avoid Overcrowding : While the indicator supports multiple extension levels, enabling too many levels simultaneously may clutter the chart. Use discretion when configuring extension levels.
Customize Line Styles and Colors : Tailor the appearance of lines and labels to align with your trading style. Use solid, dashed, or dotted lines, and choose colors that enhance visibility without cluttering the chart.
Combine with Other Tools : Pair this indicator with other technical analysis tools (e.g., moving averages, volume profiles) to enhance decision-making.
Disclaimer & Chat
The Session Extensions indicator is intended for educational and analytical purposes only. It does not provide financial advice or guarantee trading success. Users are responsible for verifying the accuracy of session times and ensuring proper configuration before using the indicator in live trading. This indicator is not a trading signal generator.
Thank you for choosing this indicator! I hope it becomes a valuable part of your trading toolkit. Remember, trading is a journey, and having the right tools can make all the difference. Whether you're a seasoned trader or just starting out, this indicator is designed to help you stay organized and focused on what matters most—price action. Happy trading, and may your charts be ever in your favor! 😊
From, Dani.

NIFTY VWAP DistanceNIFTY Futures VWAP Distance Indicator
Track price deviation from Volume-Weighted Average Price in real-time
📈 Key Features:
Measures absolute (points) and percentage distance from VWAP
Daily session reset aligned with NSE trading hours
Dual-axis visualization with clear zero reference line
Real-time data table display for instant analysis
Typical price calculation: (H+L+C)/3 formula
Built-in safeguards against division errors
🎯 Ideal For:
Intraday traders monitoring mean reversion opportunities
Algorithmic traders needing VWAP deviation metrics
Swing traders identifying overextended price moves
Market profile analysts studying auction theory
📊 How to Use:
Apply to NIFTY Futures chart (1m-1h timeframes recommended)
Blue line = Points above/below VWAP
Red line = Percentage deviation
Positive values = Price > VWAP (bullish territory)
Negative values = Price < VWAP (bearish territory)
💡 Pro Tips:
Combine with volume profile for confirmation
Watch for >1% deviations for potential reversals
Use divergence patterns for early trend change signals
Works best with raw futures data (not continuous contracts)
🔧 Technical Specs:
Pine Script v5+
No repainting
Low latency calculations
Mobile-friendly display
"Know when price strays too far from fair value"

Footprint Chart by Th16rryDescription of the "Footprint Chart" Indicator
This indicator is an approximation of a true **Footprint Chart** adapted for TradingView, which does not provide access to tick-by-tick data or detailed order book information. It relies on **heuristics** to estimate the distribution of volume between buyers and sellers for each candlestick.
Key Features:
- Estimation of Buy/Sell Volume:
The indicator splits the total volume of a candlestick into two parts based on the candle's nature:
- For a bullish candle (close > open), it assumes that **60% of the volume** is executed on the ask (buys) and **40% on the bid** (sells).
- For a bearish candle (close < open), the estimation is reversed (40% buys, 60% sells).
- For a neutral candle (close = open), the volume is evenly distributed at 50% for each side.
- Calculation of a Simplified Delta:
The delta is defined as the difference between the estimated buy volume and sell volume. This delta helps quickly identify the dominant market pressure—positive for buyer dominance and negative for seller dominance.
- Visual Display:
- A label is placed on each candlestick displaying the delta value, with a green background for a positive delta (indicating buying pressure) and red for a negative delta (indicating selling pressure).
- A table in the top-right corner of the chart summarizes the estimated volumes for the current candle: buy volume, sell volume, and total volume.
#### How to Use the Indicator:
- Analyzing Buy/Sell Pressure:
By observing the label's color and the delta value, a trader can quickly assess whether the market shows a dominant buying or selling pressure during a given candle.
- Complementing Other Tools:
This indicator can be used alongside other technical analysis tools, such as the Volume Profile or trend indicators, to gain a more comprehensive understanding of market behavior.
- Supporting Decision Making:
By providing a visual estimate of the volume distribution, it can help identify divergences between price movement and volume activity, which may signal potential reversals or confirm ongoing trends.
Limitations:
- Heuristic Approximation:
The method of volume distribution is based on simple assumptions and does not reflect the actual order flow, which would require tick-by-tick data to be accurately represented.
- Data Limitations on TradingView:
Due to TradingView’s restrictions on accessing detailed order book data, this indicator can only approximate a Footprint Chart and does not replace specialized tools.
In summary, the "Footprint Chart" indicator provides a visual and quick estimation of the volume distribution between buyers and sellers for each candlestick, offering valuable insights into order flow dynamics while remaining aware of its heuristic limitations.

Footprint IQ Pro [TradingIQ]Hello Traders!
Introducing "Footprint IQ Pro"!
Footprint IQ Pro is an all-in-one Footprint indicator with several unique features.
Features
Calculated delta at tick level
Calculated delta ratio at tick level
Calculated buy volume at tick level
Calculated sell volume at tick level
Imbalance detection
Stacked imbalance detection
Stacked imbalance alerts
Value area and POC detection
Highest +net delta levels detection
Lowest -net delta levels detection
CVD by tick levels
Customizable values area percentage
The image above thoroughly outlines what each metric in the delta boxes shows!
Metrics In Delta Boxes
"δ:", "\nδ%:", "\n⧎: ", "\n◭: ", "\n⧩: "
δ Delta (Difference between buy and sell volume)
δ% Delta Ratio (Delta as a percentage of total volume)
⧎ Total Volume At Level (Total volume at the price area)
◭ Total Buy Volume At Level (Total buy volume at the price area)
⧩ Total Sell Volume At Level (total sell volume at the price area)
Each metric comes with a corresponding symbol.
That said, until you become comfortable with the symbol, you can also turn on the descriptive labels setting!
The image above exemplifies the feature.
The image above shows Footprint IQ's full power!
Additionally, traders with an upgraded TradingView plan can make use of the "1-Second" feature Footprint IQ offers!
The image above shows each footprint generated using 1-second volume data. 1-second data is highly granular compared to 1-minute data and, consequently, each footprint is exceptionally more accurate!
Imbalance Detection
Footprint IQ pro is capable of detecting user-defined delta imbalances.
The image above further explains how Footprint IQ detects imbalances!
The imbalance percentage is customizable in the settings, and is set to 70% by default.
Therefore,
When net delta is positive, and the positive net delta constitutes >=70% of the total volume, a buying imbalance will be detected (upwards triangle).
When net delta is negative, and the negative net delta constitutes >=70% of the total volume, a buying imbalance will be detected (downwards triangle).
Stacked Imbalance Detection
In addition to imbalance detection, Footprint IQ Pro can also detect stacked imbalances!
The image above shows Footprint IQ Pro detecting stacked imbalances!
Stacked imbalances occur when consecutive imbalances at sequential price areas occur. Stacked imbalances are generally interpreted as significant price moves that are supported by volume, rather than a significant result with disproportionate effort.
The criteria for stacked imbalance detection (how many imbalances must occur at sequential price areas) is customizable in the settings.
The default value is three. Therefore, when three imbalances occur at sequential price areas, golden triangles will begin to print to show a stacked imbalance.
Additionally, traders can set alerts for when stacked imbalances occur!
Highest +Delta and Highest -Delta Levels
In addition to being a fully-fledged Footprint indicator, Footprint IQ Pro goes one step further by detecting price areas where the greater +Delta and -Delta are!
The image above shows price behavior near highest +Delta price areas detected by Footprint IQ!
These +Delta levels are considered important as there has been strong interest from buyers at these price areas when they are traded at.
It's expected that these levels can function as support points that are supported by volume.
The image above shows a similar function for resistance points!
Blue lines = High +Delta Detected Price Areas
Red lines = High -Delta Detected Price Areas
Value Area Detection
Similar to traditional volume profile, Footprint IQ Pro displays the value area per bar.
Green lines next to each footprint show the value area for the bar. The value area % is customizable in the settings.
CVD Levels
Footprint IQ Pro is capable of storing historical volume delta information to provide CVD measurements at each price area!
The image above exemplifies this feature!
When this feature is enabled, you will see the CVD of each price area, rather than the net delta!
And that's it!
Thank you so much to TradingView for offering the greatest charting platform for everyone to create on!
If you have any feature requests you'd like to see for Footprint IQ, please feel free to share them with us!
Thank you!

Uptrick: Smart BoundariesThis script is an indicator that combines the RSI (Relative Strength Index) and Bollinger Bands to highlight potential points where price momentum and volatility may both be at extreme levels. Below is a detailed explanation of its components, how it calculates signals, and why these two indicators have been merged into one tool. This script is intended solely for educational purposes and for traders who want to explore the combined use of momentum and volatility measures. Please remember that no single indicator guarantees profitable results.
Purpose of This Script
This script is designed to serve as a concise, all-in-one tool for traders seeking to track both momentum and volatility extremes in real time. By overlaying RSI signals with Bollinger Band boundaries, it helps users quickly identify points on a chart where price movement may be highly stretched. The goal is to offer a clearer snapshot of potential overbought or oversold conditions without requiring two separate indicators. Additionally, its optional pyramiding feature enables users to manage how many times they initiate trades when signals repeat in the same direction. Through these combined functions, the script aims to streamline technical analysis by consolidating two popular measures—momentum via RSI and volatility via Bollinger Bands—into a single, manageable interface.
1. Why Combine RSI and Bollinger Bands
• RSI (Relative Strength Index): This is a momentum oscillator that measures the speed and magnitude of recent price changes. It typically ranges between 0 and 100. Traders often watch for RSI crossing into “overbought” or “oversold” levels because it may indicate a potential shift in momentum.
• Bollinger Bands: These bands are plotted around a moving average, using a standard deviation multiplier to create an upper and lower boundary. They help illustrate how volatile the price has been relative to its recent average. When price moves outside these boundaries, some traders see it as a sign the price may be overstretched and could revert closer to the average.
Combining these two can be useful because it blends two different perspectives on market movement. RSI attempts to identify momentum extremes, while Bollinger Bands track volatility extremes. By looking for moments when both conditions agree, the script tries to highlight points where price might be unusually stretched in terms of both momentum and volatility.
2. How Signals Are Generated
• Buy Condition:
- RSI dips below a specified “oversold” level (for example, 30 by default).
- Price closes below the lower Bollinger Band.
When these occur together, the script draws a label indicating a potential bullish opportunity. The underlying reasoning is that momentum (RSI) suggests a stronger-than-usual sell-off, and price is also stretched below the lower Bollinger Band.
• Sell Condition:
- RSI rises above a specified “overbought” level (for example, 70 by default).
- Price closes above the upper Bollinger Band.
When these occur together, a label is plotted for a potential bearish opportunity. The rationale is that momentum (RSI) may be overheated, and the price is trading outside the top of its volatility range.
3. Pyramiding Logic and Trade Count Management
• Pyramiding refers to taking multiple positions in the same direction when signals keep firing. While some traders prefer just one position per signal, others like to scale into a trade if the market keeps pushing in their favor.
• This script uses variables that keep track of how many recent buy or sell signals have fired. If the count reaches a user-defined maximum, no more signals of that type will trigger additional labels. This protects traders from over-committing to one direction if the market conditions remain “extreme” for a prolonged period.
• If you disable the pyramiding feature, the script will only plot one label per side until the condition resets (i.e., until RSI and price conditions are no longer met).
4. Labels and Visual Feedback
• Whenever a buy or sell condition appears, the script plots a label directly on the chart:
- Buy labels under the price bar.
- Sell labels above the price bar.
These labels make it easier to review where both RSI and Bollinger Band conditions align. It can be helpful for visually scanning the chart to see if the signals show any patterns related to market reversals or trend continuations.
• The Bollinger Bands themselves are plotted so traders can see when the price is approaching or exceeding the upper or lower band. Watching the RSI and Bollinger Band plots simultaneously can give traders more context for each signal.
5. Originality and Usefulness
This script provides a distinct approach by merging two well-established concepts—RSI and Bollinger Bands—within a single framework, complemented by optional pyramiding controls. Rather than using each indicator separately, it attempts to uncover moments when momentum signals from RSI align with volatility extremes highlighted by Bollinger Bands. This combined perspective can aid in spotting areas of possible overextension in price. Additionally, the built-in pyramiding mechanism offers a method to manage multiple signals in the same direction, allowing users to adjust how aggressively they scale into trades. By integrating these elements together, the script aims to deliver a tool that caters to diverse trading styles while remaining straightforward to configure and interpret.
6. How to Use the Indicator
• Configure the Inputs:
- RSI Length (the lookback period used for the RSI calculation).
- RSI Overbought and Oversold Levels.
- Bollinger Bands Length and Multiplier (defines the moving average period and the degree of deviation).
- Option to reduce pyramiding.
• Set Alerts (Optional):
- You can create TradingView alerts for when these conditions occur, so you do not have to monitor the chart constantly. Choose the buy or sell alert conditions in your alert settings.
• Integration in a Trading Plan:
- This script alone is not a complete trading system. Consider combining it with other forms of analysis, such as support and resistance, volume profiles, or candlestick patterns. Thorough research, testing on historical data, and risk management are always recommended.
7. No Performance Guarantees
• This script does not promise any specific trading results. It is crucial to remember that no single indicator can accurately predict future market movements all the time. The script simply tries to highlight moments when two well-known indicators both point to an extreme condition.
• Actual trading decisions should factor in a range of market information, including personal risk tolerance and broader market conditions.
8. Purpose and Limitations
• Purpose:
- Provide a combined view of momentum (RSI) and volatility (Bollinger Bands) in a single script.
- Assist in spotting times when price may be at an extreme.
- Offer a configurable system for labeling potential buy or sell points based on these extremes.
• Limitations:
- Overbought and oversold conditions can persist for an extended period in trending markets.
- Bollinger Band breakouts do not always result in immediate reversals. Sometimes price keeps moving in the same direction.
- The script does not include a built-in exit strategy or risk management rules. Traders must handle these themselves.
Additional Disclosures
This script is published open-source and does not rely on any external or private libraries. It does not use lookahead methods or repaint signals; all calculations are performed on the current bar without referencing future data. Furthermore, the script is designed for standard candlestick or bar charts rather than non-standard chart types (e.g., Heikin Ashi, Renko). Traders should keep in mind that while the script can help locate potential momentum and volatility extremes, it does not include an exit strategy or account for factors like slippage or commission. All code comes from built-in Pine Script functions and standard formulas for RSI and Bollinger Bands. Anyone reviewing or modifying this script should exercise caution and incorporate proper risk management when applying it to their own trading.
Calculation Details
The script computes RSI by examining a user-defined number of prior bars (the RSI Length) and determining the average of up-moves relative to the average of down-moves over that period. This ratio is then scaled to a 0–100 range, so lower values typically indicate stronger downward momentum, while higher values suggest stronger upward momentum. In parallel, Bollinger Bands are generated by first calculating a simple moving average (SMA) of the closing price for the user-specified length. The script then measures the standard deviation of closing prices over the same period and multiplies it by the chosen factor (the Bollinger Bands Multiplier) to form the upper and lower boundaries around the SMA. These two measures are checked in tandem: if the RSI dips below a certain oversold threshold and price trades below the lower Bollinger Band, a condition is met that may imply a strong short-term sell-off; similarly, if the RSI surpasses the overbought threshold and price rises above the upper Band, it may indicate an overextended move to the upside. The pyramiding counters track how many of these signals occur in sequence, preventing excessive stacking of labels on the chart if conditions remain extreme for multiple bars.
Conclusion
This indicator aims to provide a more complete view of potential market extremes by overlaying the RSI’s momentum readings on top of Bollinger Band volatility signals. By doing so, it attempts to help traders see when both indicators suggest that the market might be oversold or overbought. The optional reduced pyramiding logic further refines how many signals appear, giving users the choice of a single entry or multiple scaling entries. It does not claim any guaranteed success or predictive power, but rather serves as a tool for those wanting to explore this combined approach. Always be cautious and consider multiple factors before placing any trades.

Scatter PlotThe Price Volume Scatter Plot publication aims to provide intrabar detail as a Scatter Plot .
🔶 USAGE
A dot is drawn at every intrabar close price and its corresponding volume , as can seen in the following example:
Price is placed against the white y-axis, where volume is represented on the orange x-axis.
🔹 More detail
A Scatter Plot can be beneficial because it shows more detail compared with a Volume Profile (seen at the right of the Scatter Plot).
The Scatter Plot is accompanied by a "Line of Best Fit" (linear regression line) to help identify the underlying direction, which can be helpful in interpretation/evaluation.
It can be set as a screener by putting multiple layouts together.
🔹 Easier Interpretation
Instead of analysing the 1-minute chart together with volume, this can be visualised in the Scatter Plot, giving a straightforward and easy-to-interpret image of intrabar volume per price level.
One of the scatter plot's advantages is that volumes at the same price level are added to each other.
A dot on the scatter plot represents the cumulated amount of volume at that particular price level, regardless of whether the price closed one or more times at that price level.
Depending on the setting "Direction" , which sets the direction of the Volume-axis, users can hoover to see the corresponding price/volume.
🔹 Highest Intrabar Volume Values
Users can display up to 5 last maximum intrabar volume values, together with the intrabar timeframe (Res)
🔹 Practical Examples
When we divide the recent bar into three parts, the following can be noticed:
Price spends most of its time in the upper part, with relative medium-low volume, since the intrabar close prices are mostly situated in the upper left quadrant.
Price spends a shorter time in the middle part, with relative medium-low volume.
Price moved rarely below 61800 (the lowest part), but it was associated with high volume. None of the intrabar close prices reached the lowest area, and the price bounced back.
In the following example, the latest weekly candle shows a rejection of the 45.8 - 48.5K area, with the highest volume at the 45.8K level.
The next three successive candles show a declining maximum intrabar volume, after which the price broke through the 45.8K area.
🔹 Visual Options
There are many visual options available.
🔹 Change Direction
The Scatter Plot can be set in 4 different directions.
🔶 NOTES
🔹 Notes
The script uses the maximum available resources to draw the price/volume dots, which are 500 boxes and 500 labels. When the population size exceeds 1000, a warning is provided ( Not all data is shown ); otherwise, only the population size is displayed.
The Scatter Plot ideally needs a chart which contains at least 100 bars. When it contains less, a warning will be shown: bars < 100, not all data is shown
🔹 LTF Settings
When 'Auto' is enabled ( Settings , LTF ), the LTF will be the nearest possible x times smaller TF than the current TF. When 'Premium' is disabled, the minimum TF will always be 1 minute to ensure TradingView plans lower than Premium don't get an error.
Examples with current Daily TF (when Premium is enabled):
500 : 3 minute LTF
1500 (default): 1 minute LTF
5000: 30 seconds LTF (1 minute if Premium is disabled)
🔶 SETTINGS
Direction: Direction of Volume-axis; Left, Right, Up or Down
🔹 LTF
LTF: LTF setting
Auto + multiple: Adjusts the initial set LTF
Premium: Enable when your TradingView plan is Premium or higher
🔹 Character
Character: Style of Price/Volume dot
Fade: Increasing this number fades dots at lower price/volume
Color
🔹 Linear Regression
Toggle (enable/disable), color, linestyle
Center Cross: Toggle, color
🔹 Background Color
Fade: Increasing this number fades the background color near lower values
Volume: Background color that intensifies as the volume value on the volume-axis increases
Price: Background color that intensifies as the price value on the price-axis increases
🔹 Labels
Size: Size of price/volume labels
Volume: Color for volume labels/axis
Price: Color for price labels/axis
Display Population Size: Show the population size + warning if it exceeds 1000
🔹 Dashboard
Location: Location of dashboard
Size: Text size
Display LTF: Display the intrabar Lower Timeframe used
Highest IB volume: Display up to 5 previous highest Intrabar Volume values

Bull Bear Candles with Volume ProfileUser Guide for Bull Bear Candles Indicator with Keltner Channels
Author: NellyN
Introduction
This indicator helps identify potential bullish and bearish trends in the market by analyzing buying and selling volume over two configurable timeframes. It calculates the percentage of buying and selling volume and displays the current market condition based on two moving averages for 2 periods.
Key Features
• Volume Analysis : Calculates Buy and Sell Volume for two configurable timeframes (e.g., 5 min, 15 min, 15 min. and 1 hour, etc.) and displays them as percentages.
• Moving Averages : Uses one Moving Average (MA) for two different time periods to identify trends (uptrend when shorter-term MA is above longer-term MA). You can also choose other Moving Average types like SMA, EMA, WMA, RMA, VWMA, or HMA.
• Colored Candles : Candles are colored green for bullish conditions, red for bearish conditions, and gray for neutral conditions.
• Market Condition Labels : Displays labels in table-view indicating the current market condition based on Buy and Sell Volume (Very Bullish, Very Bearish, Bullish/Bearish Retracement, Chop).
• Alerts: Generates alerts for potential buy and sell signals based on indicator conditions (Note: Enable alerts in the indicator settings).
• Visual Signals: Provides visual signals through colored candles and market condition labels in addition to alerts.
Input Parameters
• Source: Close price (default) or Heikin Ashi
• Timeframe: Select the timeframe for price and volume data used in the indicator (e.g., Daily, Hourly).
• Colored Candles On: Enable (True) or disable (False) coloring candles based on market conditions.
• Enable Alerts: Enable (True) or disable (False) alerts for buy/sell signals.
• Length of MA: Sets the length for the MAs used in trend identification (minimum 1).
• Lookback Period Vol. 1 & 2: Define the timeframes used to calculate buying and selling volume and the MA calculation (e.g., 5 min, 15 min).
Understanding the Outputs
• Cloud Fill: The area between two MAs is filled with a color that reflects the trend (green for uptrend, red for downtrend).
• Table: Shows Buy Volume, Sell Volume, Buy Percentage, Sell Percentage, and the current Market Condition Labels. (If you decide to see them uncomment them from the code simply removing the // in front of the code)
• Colored Candles and Market Condition Labels: Look for green candles and bullish labels for potential buying opportunities, and vice versa for red candles and bearish labels.
Bullish green label appears when short-term MA is above long-term MA AND Buy Volume percentage is greater than 50%.
Red cross for exiting long entry appears when we have bearish volume OR bearish crossover of the MA for the 2 periods.
Bearish red label appears when short-term MA is below long-term MA AND Buy Volume percentage is less than 50%.
Green cross for exiting short entry appears when we have bullish volume OR bullish crossover of the MA for the 2 periods.
• Bullish/Bearish Retracement: The moving averages indicate a potential trend reversal, while the Buy Volume percentage suggests a continuation of the prior trend. The candle color may be green, red, or gray depending on the current price position relative to the moving averages.
• Chop (Gray Candle): The moving averages are flat and the Buy Volume percentage is not significantly above or below 50%.
• Buy/Sell Alerts: The indicator generates alerts based on specific conditions, but these should be used in conjunction with other trading strategies and careful risk management.
Important Notes
• This indicator is for informational purposes only and should not be considered financial advice. Back-test the indicator with historical data to understand its performance before using it for live trading.
• Combine this indicator with other technical analysis tools.

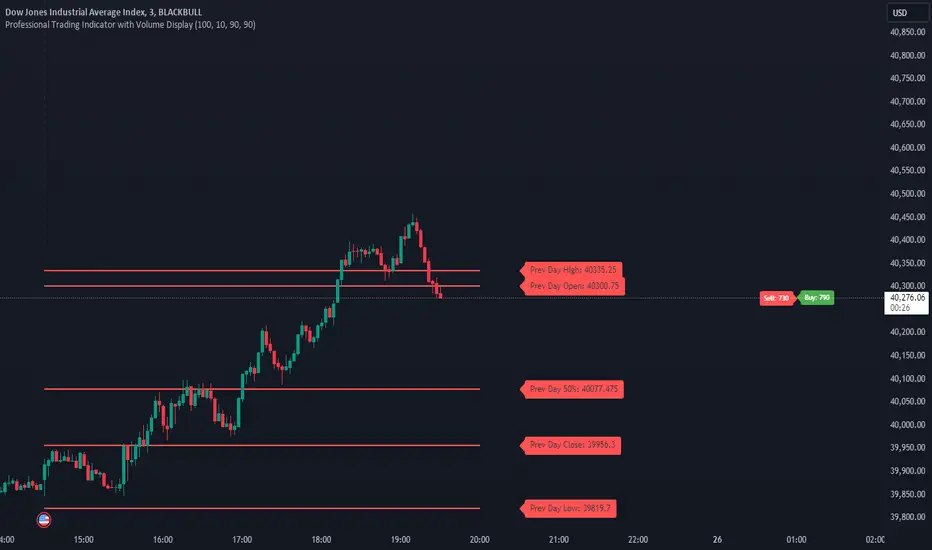
MultiTFlevels with Volume Display1. Overview
This indicator is intended for use on trading platforms like TradingView and provides the following features:
Volume Profile Analysis:
Shows cumulative volume delta (CVD) and displays buying and selling volumes.
Historical OHLC Levels:
Plots historical open, high, low, and close levels for various timeframes (e.g., daily, weekly, monthly).
Customizable Settings:
Allows users to toggle different elements and customize display options.
2. Inputs
Timeframe Display Toggles:
Users can choose to display OHLC levels from different timeframes such as previous month, week, day, 4H, 1H, 30M, 15M, and 5M.
CVD Display Toggle: Option to show or hide the Cumulative Volume Delta (CVD).
Line and Label Customization:
leftOffset and rightOffset: Define how far lines are extended left and right from the current bar.
colorMonth, colorWeek, etc.: Customize colors for different timeframe OHLC levels.
labelOffset and rightOffset: Control the positioning of volume labels.
3. Key Features
Cumulative Volume Delta (CVD)
Calculation:
Computes the cumulative volume delta by adding or subtracting the volume based on whether the close price is higher or lower than the open price.
Display:
Shows a label on the chart indicating the current CVD value and whether the market is leaning towards buying or selling.
Historical OHLC Levels
Data Retrieval:
Uses the request.security function to fetch OHLC data from different timeframes (e.g., monthly, weekly, daily).
Plotting:
Draws lines and labels on the chart to represent open, high, low, and close levels for each selected timeframe.
Buying and Selling Volumes
Calculation:
Calculates buying and selling volumes based on whether the close price is higher or lower than the open price.
Display:
Shows labels on the chart for buying and selling volumes.
4. Functions
getOHLC(timeframe)
Retrieves open, high, low, and close values from the specified timeframe.
plotOHLC(show, open, high, low, close, col, prefix)
Draws OHLC lines and labels on the chart for the given timeframe and color.
5. Usage
Chart Overlay: The indicator is overlaid on the main chart (i.e., it appears directly on the price chart).
Historical Analysis:
Useful for analyzing historical price levels and volume dynamics across different timeframes.
Volume Insights:
Helps traders understand the cumulative volume behavior and market sentiment through the CVD and volume labels.
In essence, this indicator provides a comprehensive view of historical price levels across multiple timeframes and the dynamics of market volume through CVD and volume labels. It can be particularly useful for traders looking to combine price action with volume analysis for a more in-depth market assessment.
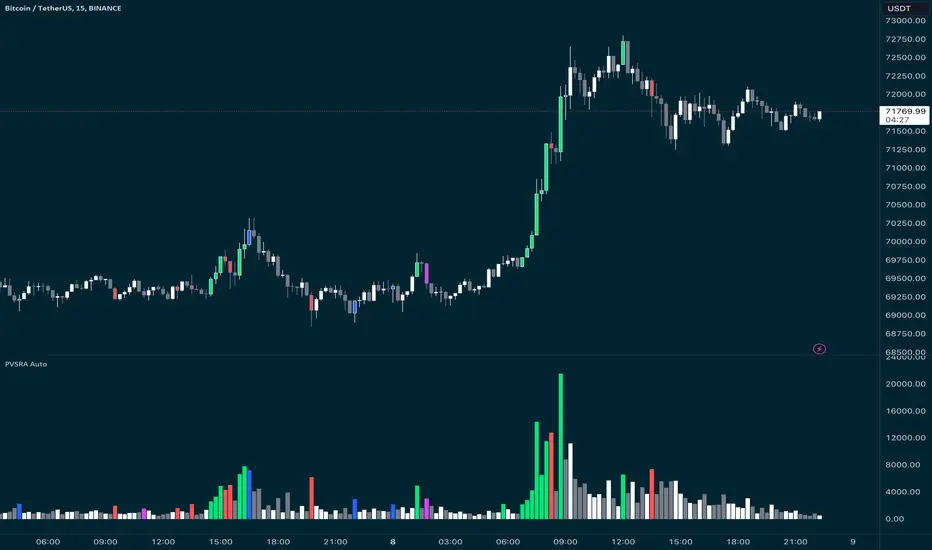
PVSRA Candles Auto OverrideWhat does this “PVSRA Candles Auto Override” Indicator
do?
This indicator automates PVSRA analysis for crypto traders. It finds the corresponding Binance Perpetual Futures chart for the current instrument, then replaces the current chart's volume profile with the perpetual futures data (if available) to ensure the PVSRA calculation uses the most relevant volume. This not only reduces human error during market scans but also automatically selects the appropriate Binance Perpetual Futures contract, saving time and improving the accuracy of PVSRA calculations.
How can a trader use this indicator?
This helps the trader to identify if there is volume data available in an equivalent Binance Perpetual Futures chart and automatically displays it, making it easier to switch coins whilst viewing the market. Why do we want to use Binance Perpetual Futures Volume? In most markets Binance volume surpasses those of other crypto exchanges so this will give us a better view on the volume spikes in the market.
What is PVSRA and how can I trade using this indicator?
PVSRA candles are a type of candlestick chart formatting. PVSRA stands for Price, Volume, Support and Resistance Analysis.
Here's a breakdown of what PVSRA candles aim to achieve:
Combine multiple factors: They take into account price movement, trading volume, and support and resistance levels to identify potential trading opportunities.
Highlight potential imbalances: By color-coding candles based on PVSRA analysis, they aim to show areas of high volume activity, potentially representing imbalances created by market makers (large institutions that influence price).
Identify areas of revisit: The theory is that these high-volume zones may be revisited by the market in the future, as there's "unrecovered liquidity" in those areas.
Usage of the Indicator:
By default the indicator will automatically use the Equivalent Binance Perpetual Chart for the Data
You can override the symbol manually if you what to view another instrument’s data.
POC IndicatorThis simplified Point of Control (POC) indicator for TradingView is designed to identify and plot the price level where the highest volume of trading occurred over a specified period. The script works as follows:
Input and Initialization: The user specifies a length for the analysis period. Variables highestVolPrice and highestVol are initialized to track the price with the highest volume and the highest volume encountered, respectively.
Volume Analysis Loop: For each bar in the specified period (up to length bars back from the current bar), the script compares the volume of the current bar (volume ) to highestVol. If the current bar's volume is higher, highestVol and highestVolPrice are updated to reflect the volume and closing price of the current bar.
Plotting the POC: Instead of using a horizontal line (hline), which cannot be dynamically updated within the loop, the script uses plot to draw the POC. This plotting function draws a line on the chart that represents the closing price level associated with the highest volume observed within the analysis period.
Resetting Variables: To ensure the indicator updates correctly with each new bar, the script resets highestVol and highestVolPrice at the start of the analysis for each new period. This step is designed to recalculate the POC dynamically as new data comes in.
This approach offers a basic method for visualizing significant price levels where substantial trading activity occurred, potentially indicating areas of strong support or resistance. However, it's a simplified model and does not calculate the true POC based on a detailed volume profile across all price levels within the period.
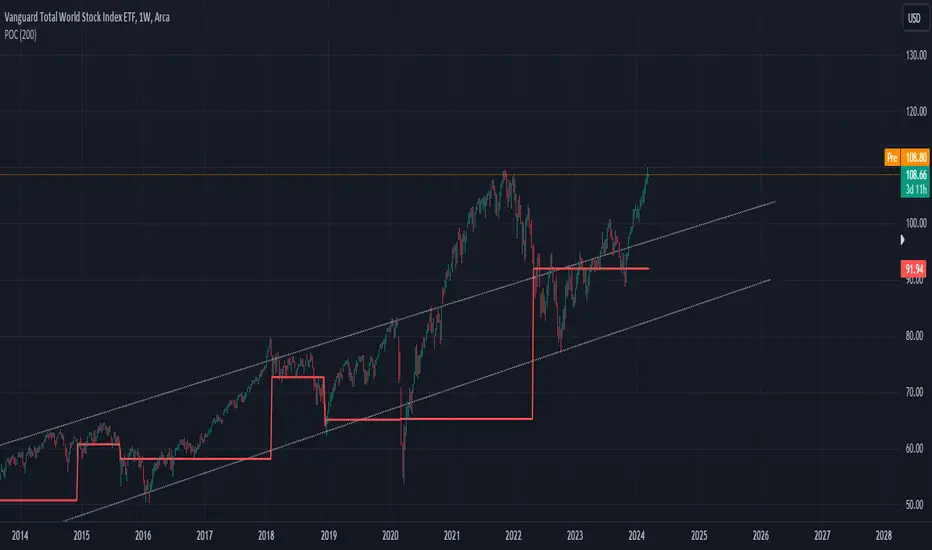
Balance Zone ExtensionBalance zones are an aspect of trading that many traders notice. Balance Zones are formed when a market is in equilibrium and respects a certain high and low multiple times. These zones could also be called accumulation or distribution areas depending on the price action. If the term "choppy" is used to describe a given markets price action, it is probably a fair statement to say that the market is currently in a Balance Zone.
This script is a take on vwaptrader1's teachings where you take a balance zone and "double it" to get a target if/when it does break out of balance. It provides an automated way of extending levels based on a given balance range.
The lines plotted by the script are calculated based off of the balance high/low inputs, how many sections are desired per zone, and how many boxes to plot based on the other user inputs.
Warning: Due to a current limitation of the Pine, this script is only allowed to plot up to 500 lines total. If you start to notice lines starting to disappear or you begin getting a script error, double check the input settings as the script may have crossed the 500 line threshold.
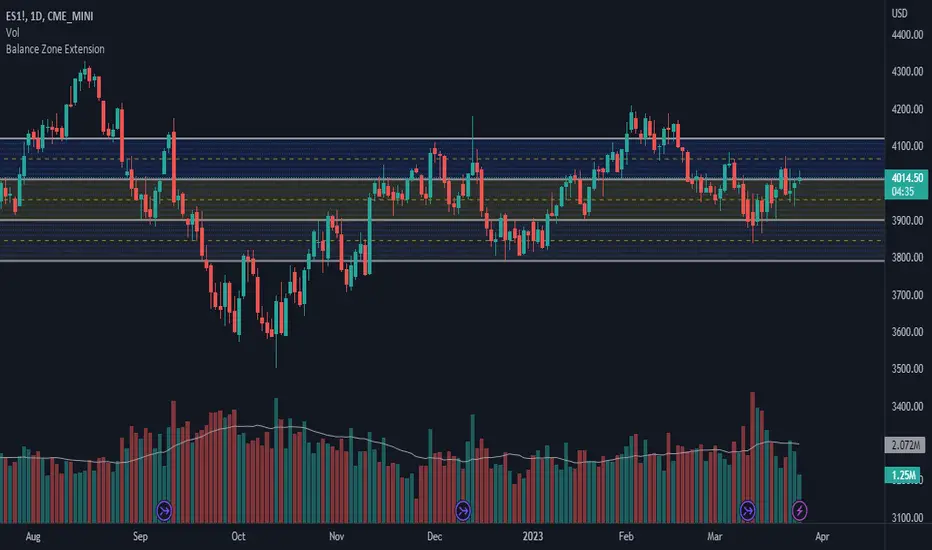
This can be used in conjunction with Fixed Range Volume Profile . Select the balance range with the Fixed Volume Profile . Note the Value Area High and Value Area Low prices and input those into the balance range High/Low inputs.
Use to create price targets from Balance Zone Breakouts
A recent example of this idea in action on ticker ES1! 2 hour chart where the balance range was found and the target (double the box size of the balance range) was hit.
Another example of this same concept but on a normal security like AAPL but on a 30 minute chart:
Extending the usefulness even further to crypto on BTCUSD with a 5 minute chart:
Use to create reference levels for future price action
The other way to utilize this is to provide future reference levels from a key balance range from the past.
Here is another example utilizing the AMD daily chart . First, a balance zone was noted for all of 2017:
Moving forward to the most recent price action in 2023, notice that the box extension levels are still fairly well respected almost 6 years later!
VWAP Boulevard [vnhilton](OVERVIEW)
The idea of this indicator comes from traders identifying supply to mainly look for shorts. Scenarios would be gap ups or pump & dumps where huge volume is transacted, & bag-holders are present. Some traders would draw resistance lines, I myself used to draw supply zones using the volume profile on that day, & others used the day VWAP on those days. VWAP Boulevard (I believe the name comes from the trader named team3dstocks) draws day VWAP lines from the highest volume days for a given period (excluding the current day).
(FEATURES)
- Draws horizontal & vertical lines from up to 250 highest volume days out of up to 3568 days, with the ability to hide either of these lines, their thicknesses, styles
- Extend/cut horizontal lines, or extend them all the way to the right
- Show the day VWAP, volume & age for these days in labels, with the ability to show what information you want to see only
- Separate customizable color forms for the lines & labels - ordinary (1 color); volume (2 color gradient from lowest to highest volume of the highest volume days); age (2 color gradient from youngest to oldest volume of the highest volume days)
- Edit offset & size of labels, & hide them
- Hide vertical lines
From left to right: Age color; ordinary color; volume color
250 highest volume days in the past year. Very messy so it's very likely you won't be using this but the ability to draw lines from 250 highest volume days is there if needed
(DRAWDOWNS)
- This indicator will only on the daily timeframe (error message will show up if unaware of this, & can be toggled off). Unfortunately, this would mean you would have to draw the lines manually yourself if you wish to use them on intraday timeframes.
- You may also encounter the 'Pine cannot determine the referencing length of a series. Try using max_bars_back' error. This occurs when the lookback period is very high & the indicator attempts to recalculate I believe. If this happens then reload the indicator.
The logic I used to obtain the highest volume days were to put all of the volume days in a given period in 1 array, then to sort them from highest to lowest, & also store their sorted indices in an separate array as well, so that drawings for each volume day could be done from the 2 arrays.
//Volume for last N periods
var int pastVol = array.new_int(lookbackPeriodFixed)
for i = 0 to lookbackPeriodFixed - 1
array.set(pastVol, i, int(volume ))
sortedIndices = array.sort_indices(pastVol, order.descending) //All Indices of sorted volume from highest to lowest
sortedIndices2 = array.slice(sortedIndices, 0, highestVolDays) //Indices of sorted volume from highest to lowest
array.sort(pastVol, order.descending) //All Volume sorted from highest to lowest
pastVol2 = array.slice(pastVol, 0, highestVolDays) //Volume sorted from highest to lowest
//Drawings
for i = 0 to highestVolDays - 1
index := array.get(sortedIndices, i)
vol := array.get(pastVol, i)
Since these array sizes were determined from the lookback period, it would mean that the request.security() function used to obtain daily values on intraday timeframes wouldn't work for a lookback period >20 (20 * 2 values I believe, which are the day VWAP & the day volume) as TradingView has put a maximum amount of calls of 40 in 1 script. Therefore, for intraday plots to work I would have to change the logic for getting the day VWAP & day volume for the highest days, as the request.security() function doesn't work on for loops, & this would also mean that the user would only be able to draw lines from up to 20 highest volume days instead of 250. I couldn't go forward with this as I wasn't able to find the logic to pick the highest volume days & their day VWAPs & times (indexes) without using a for loop. If anyone has any solutions (including for the 'Pine cannot determine the referencing length of a series. Try using max_bars_back' error) then please let me know. I've also left commented-out code for dealing with intraday drawings for future use.

RSI ProfileThis indicator shows the RSI profile from historical RSI Value and High / Low RSI Pivots.
It is inspired by the Volume Profile which is a common charting study that indicates activity at specified levels. It plots a histogram on the chart meant to identify dominant/significant levels.
This script is profiling RSI levels into a histogram, which can identify the crucial RSI values in the chart. Along with the pivot options that can help identify the dominant pivot points where RSI values had been rebounding historically.
How to use:
There are three profile types available in the settings. When selecting RSI Values, the indicator will count RSI values from history, and plot the count in a histogram at the end of the chart. If you select RSI Pivots High or RSI Pivots Low, the indicator will count only the RSI Pivot Highs and Lows and plot the count in a histogram. Users can select the Pivot Left/Right length from the settings.
Users can extend the POC line to the left, to study how the values had been reacting to POC
Please note: Since the RSi values range from 0 to 100, the indicator is rounding off the values to absolute numbers. This can cause a situation where multiple POC are identified, to find the unique POC, you can increase the width of the histogram.
The Max/Min RSI settings are for visual purposes only, it can help users shrink down the histogram's top and bottom visibility

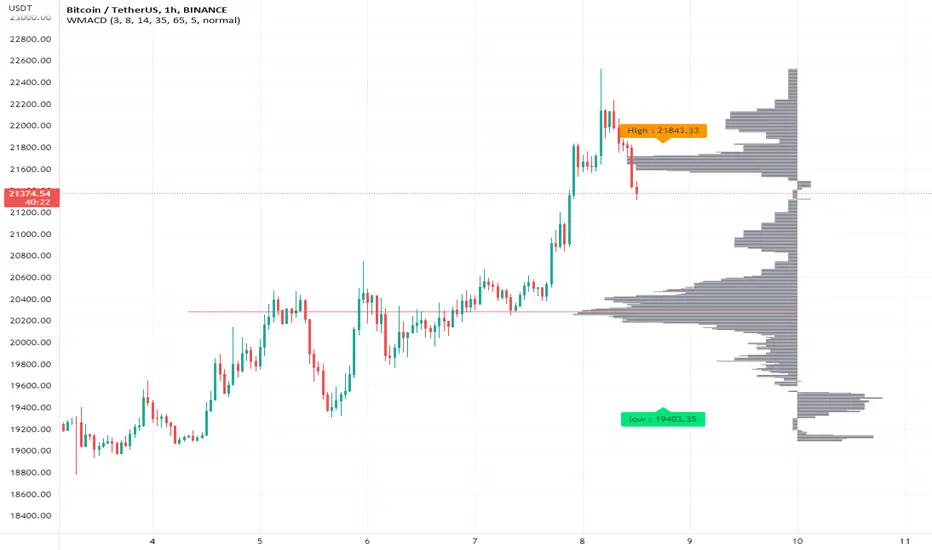
WMACDThis is MACD but little different.
The idea behind this is to use MACD to find resistance and support level first. So we can use the logic of volume profiles for this setting and by imply the MACD on it you can make the hybrid for it .
The line represent the both resistance level and if macd is above or bellow the zero
if line is red the macd is bellow zero if it lime then it above zero .
The bars represent the macd (in gray) - left side is buy and right side is sell
so how to use it ?
for example : if MACD is red and price is bellow the line we are in bear state and the line represent the resistance
lets say price bellow the line and macd line is green then this is buy signal and our goal is to reach the price of the supposed resistance
, if price break the line up then we are in bull time mode and strong buy .
Now our line will become the support line .
you can change the setting of the MACD to make it more sensitive or less sensitive as regular macd with fast and slow length
This is a concept idea how to make the MACD to find resistance and support level
so try to play with it to see how it work
Volume Spikes & Growing Volume Signals With Alerts & ScannerVOLUME SPIKES & GROWING VOLUME SIGNALS WITH ALERTS & SCANNER
This indicator shows arrows when there is a volume spike. It also paints the background when volume is growing. There is also a volume scanner for 8 tickers that will change color in real time when your other favorite tickers see volume growth and spikes.
You can customize the length of DMI, the number of bars to calculate the current volume average from, the number of bars back to get the overall volume average from, the multiple that needs to be hit to give a signal, the position of the scanner table and which tickers are used in the scanner. There are detailed directions as tooltips in the indicator settings you can read to understand exactly what each input does.
All features are customizable as well as which tickers the screener uses.
***HOW TO USE***
Watch for volume to pick up before placing trades as this will help you stay out of the markets when price is choppy. Volume usually brings volatility so watch for the volume signals to show up on the chart. Typically when price has made a big move one direction or is consolidating and you see the volume indicator start giving signals, the market is ready to reverse or continue its current trend but move faster in that direction.
Volume Spikes
When there is a volume spike that is larger than the average of volume over the last 100+ bars(depending on your settings) multiplied by the volume amount multiplier(in your settings) then an arrow will show up on the chart. This arrow will be green if DMI is bullish and red if DMI is bearish.
Volume Growth
A Background color will appear when the average volume over the last 5 bars(depending on your settings) is higher than the average volume over the last 100+ bars(depending on your settings) and is greater than your multiple. It will also paint the background when the volume moving average has increased over the last 3 bars consecutively. The background colors will be red or green depending on buy & sell pressure(DMI). If the background color appears, then you know volume is growing and volatility is near.
Volume Scanner
The scanner can be customized to have all of your favorite tickers by changing the tickers used in the indicator settings at the bottom. When no volume growth or spikes are detected, the ticker will show as light blue. When volume spikes or growth is detected, the ticker will turn orange to notify you.
Alerts
You can set up alerts as well when there is volume growth, bullish volume spikes and bearish volume spikes on any chart or timeframe.
Indicator Settings
Settings will need to be adjusted across different tickers as some have large swings in volume and some stay pretty even, so make sure to set up different chart layouts with settings that work for each ticker and save them individually so you don’t have to reset these values every time you switch charts.
***MARKETS***
This indicator can be used as a signal on all markets, including stocks, crypto, futures and forex as long as Tradingview has volume and DMI data for that ticker.
***TIMEFRAMES***
This volume spike indicator can be used on all timeframes as long as there is enough data for Tradingview to use for calculations.
***TIPS***
Try using numerous indicators of ours on your chart so you can instantly see the bullish or bearish trend of multiple indicators in real time without having to analyze the data. Some of our favorites are our Auto Fibonacci, Volume Profile, Momentum, Auto Support And Resistance and Money Flow Index in combination with this Volume Growth indicator. They all have real time Bullish and Bearish labels as well so you can immediately understand each indicator's trend.

Fr3d0's Volume Profile Visible RangeLow level implementation
At the core of VPVR there’s a concept called “bucketization”.
Question : what is bucketization?
Answer : bucketization consists of identifying metrics with high predictive power and combine them appropriately.
I think this is a problem of bucketization because what the VPVR does is to take a price range, divide it into buckets and fill them up with the volume that was produced in each bucket’s range over the given period.
The more we divide our price range the finer the resolution, but also the less significant each bucket will become.
The steps are :
1. Get the price range with min and max over the give period;
2. Divide the range into buckets;
3. Loop over each candle of the given period and proportionally assign volume to one or more bucket.
Question : how to assign volume to buckets?
Answer : we need to calculate the right amount to add to each bucket for each candle. If 20% of a candle lies on a bucket then that bucket needs to have 20% of the volume of that candle, the rest 80% belongs to other buckets.
To get the percentage of a candle on a given bucket we have to find the price range of the candle contained within the bucket, then divide that amount by the entire length of the candle.
How to bucketize
Question : what are the formulas of A, B, C and Target respectively?
Answer :
- A = Max(candle_high, bucket_top) - Min(candle_low, bucket_bottom);
- B = Max(candle_high, bucket_top) - Min(candle_high, bucket_top);
- C = Max(candle_low, bucket_bottom) - Min(candle_low, bucket_bottom);
- Target = A - B - C.
Now that we now how to calculate the price range belonging to each bucket we need to calculate a percentage of volume to fill the bucket with.
The formula is trivially simple :
Volume * Target / (candle_high - candle_low).
Question : can we distinguish between buy volume and sell volume? If so, how?
Answer : yes we can and the following paragraph will teach you how.
Put it simply we can use the difference between the extremes of a candle (low and high) and its close price to get the buy and sell volumes.
The formulas for that are :
- Buy volume = Volume * (close - low) / (high - low);
- Sell volume = Volume * (high - close) / (high - low).
I know this is rather simplicistic but it makes sense.
Closing thoughts
This script is a working progress and I’m going to give more details if necessary, just let me know in the comments down below.
Market Profile with TPOThis is is Market Profile with TPO (the letters) on the current session. Due to pinescript limitations, we are limited to 500 TPOs, since this script uses 1 label per TPO. It is NOT volume profile, this is Time Profile (Time spent at a price).

[francrypto® strategy] 4 EMAs, P.SAR & Vol.Prof. (by kv4coins)(ENG)
This script consists of my own strategy for cryptocurrency (but can be adapted very well for stocks, forex, etc.)
Is a combination of:
- Four Exponentials Moving Average (EMA), configurables: by defect are 10, 21, 55 and 200 periods in yellow, aqua, orange and blue each of them
- Parabolic SAR System (PSAR), configurable
- Volume Profile (that has been developed by kv4coins - he has already authorized me to use it under the same OSS Licence Terms: MPL 2.0), configurable: with another default values and bilingual support for Spanish (SPA)
How it works
1) It is always better to detect specifics candlesticks or patrons: doji , pinbar or inverted pinbar , engulfing bars , morning star or evening star , harami , twizzer bottom or top , etc.
2) The 10 and 21 periods EMA help to identify the short-term behavior
3) The 55 periods EMA can be used like a support or resistance in medium-term, as 200 periods EMA in very long-term
4) It will convenient search for a double cross (10 & 21) or a triple cross (10, 21 & 55) to determine the medium-term change Downtrend to UpTrend (or viceversa)
5) Confirm the change patron with the Parabolic SAR and then identify potencials purchases or sales
6) Use Volume profile to detect potential supports or resistances areas, in order to set stop limit/loss and take profit orders.
Hope this helps!
Cheers,
FRANCRYPTO®
–––––– 0 ––––––
(ESP)
Este script consiste en mi propia estrategia para criptomonedas (pero puede adaptarse muy bien para acciones, forex, etc.)
Es la combinación de:
1) Cuatro Medias Móviles Exponenciales (EMA), configurables: por defecto son de 10, 21, 55 y 200 períodos en amarillo, turquesa, naranja y azul cada una de ellas
2) Sistema Parabolic SAR (PSAR), configurable
3) Perfil de Volumen (que fuera desarrollado por kv4coins - que ya me ha autorizado a su uso bajo las mismas condiciones de la Licencia OSS: MPL 2.0), configurable: con otros valores por defecto y soporte bilingüe para Español (SPA)
Cómo funciona
1) Siempre va a resultar mejor detectar velas japonesas específicas o patrones: doji , martillos o martillos invertidos , velas envolventes , patrón amanecer o atardecer , harami , velas gemelas , etcétera
2) La EMA de 10 y 21 períodos ayudan a identificar el comportamiento de corto plazo
3) La EMA de 55 períodos puede ser usada como un soporte o resistencia de mediano plazo, como así también, la EMA de 200 períodos en el muy largo plazo
4) Será conveniente buscar un doble cruce (10 & 21) o un triple cruce (10, 21 & 55) para determinar un cambio de la tendencia de mediano plazo de bajista hacia alcista (o viceversa)
5) Confirmá el patrón de cambio con la Parabólica de SAR y entonces identificá potenciales compras o ventas
6) Usá el perfil de volumen para detectar las potenciales zonas de soporte o resistencia, principalmente para establecer ordenes stop limit/loss o take profit.
¡Espero que pueda serles de utilidad!
Saludos,
FRANCRYPTO®
